||| EARTHRISE BY JAY KIMBALL |||
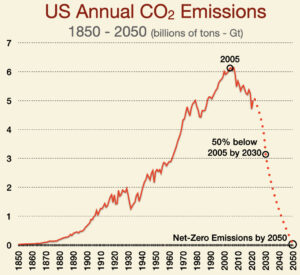 The U.S. has set a goal of reducing U.S. greenhouse gas emissions (GHGs) at least 50% below 2005 levels by 2030 (see chart at right).
Reversing over 170 years of unbridled burning of fossil fuels is no small task. But there is some good news here in our little corner of the planet.
One Big Thing
In San Juan County, about 78% of GHGs come from just one thing – transportation. Therefore, transitioning to clean transportation is one of the most powerful climate actions we can take to reduce local direct emissions.
The chart below shows an estimate of how many tons of GHGs are emitted each year for the top seven emission sources in the county.
Let’s dive into the details:
- The red bars are fossil-fueled transportation sources – cars, trucks, and ferries – burning gasoline and diesel.
- The largest portion of transportation emissions comes from visitors driving around the islands. Diesel-powered ferries are the next largest source, with driving by locals/residents bringing up the rear.
- For comparison, we also show how the tons of GHG emissions from a 300-acre forest fire (red dashed line) are comparable to a year’s worth of visitor driving. Reducing wildfire risk is becoming a top priority as the climate crisis accelerates extreme drought events.
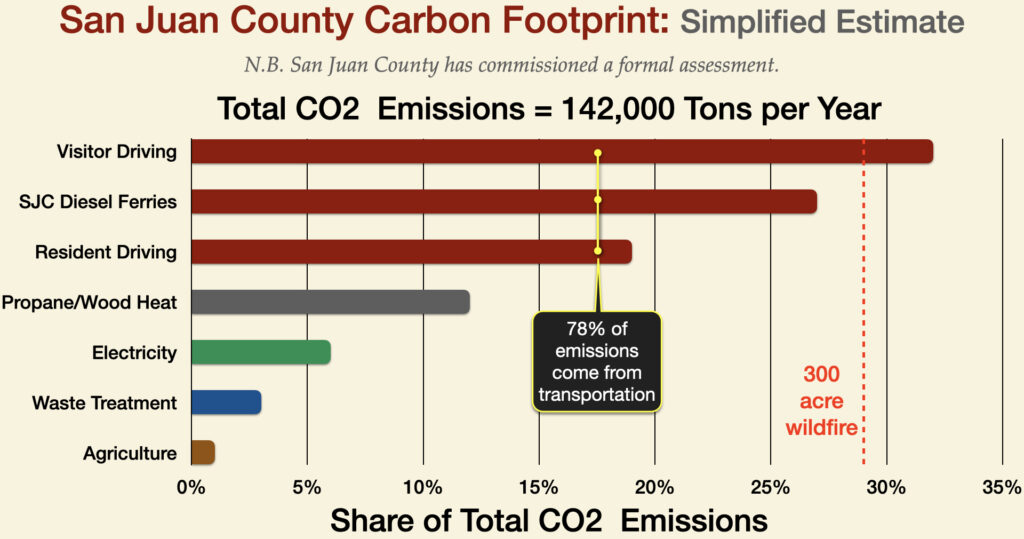
This estimate is based on a “back of the envelope” inventory of the county’s largest sources of GHGs. Last year the county council approved the preparation of a comprehensive GHG inventory, a strong recommendation of the county Climate and Sustainability Advisor Committee. The inventory is being prepared by Seattle-based Cascadia Consulting Group and should be available in May. The GHG inventory will be essential to all county climate action and comprehensive planning.
Focusing on Visitor Transportation
Take a little trip, take a little trip
Take a little trip and see
Take a little trip, take a little trip
Take a little trip with me
~ Low Rider, Song by War
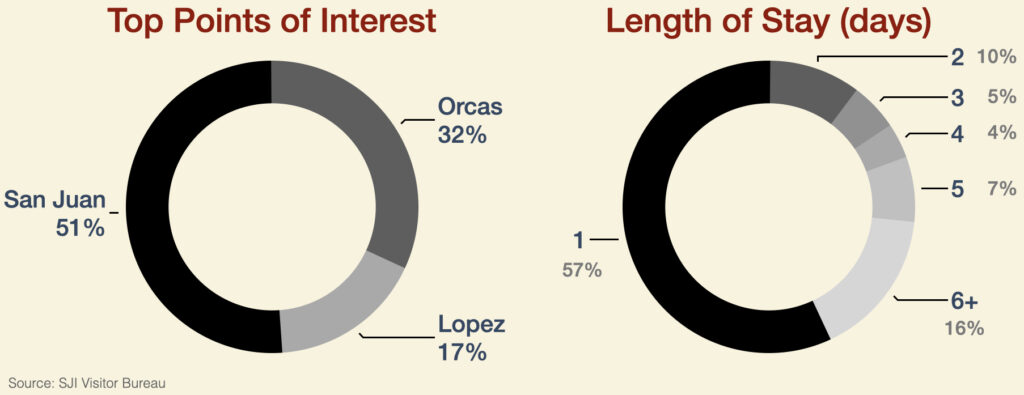
Looking at 2022 visitor data, 553,000 visitors made just under one million trips (some visiting more than once) to the islands last year, staying in the islands for an average of 2.5 days.
About 82% of visitors to the county come from within Washington state. About 4% come from Oregon, and 3% from California.
The chart below left shows the top points of interest for visitors. The chart below right shows how long visitors stay. It is likely that many of the visitors that are here for a day or less are driving commercial vehicles, and of those, many are diesel trucks making deliveries of goods from the mainland. As with our diesel ferries, diesel trucks emit an especially potent toxic brew of GHGs and diesel particulate matter (DPM).
There is no single clean transportation solution that will address the diverse transportation needs of visitors and islanders. However, several potential solutions hold promise for significant portions of the local and visitor populations. Members of the county Climate and Sustainability Advisory Committee and Council Member Jane Fuller have been exploring emerging clean transportation options with the Washington Department of Transportation and others.
In the next Earthrise post, we will look at how other island communities are reducing their transportation-related GHGs while increasing more equitable transportation systems that improve access for all.
Earthrise: A Climate Action Journal
This climate action journal offers information and actions we can take together, locally and globally, as we care for this precious Earth.
“The best way to heal a living system, is to connect it with more parts of itself.” ~ Margaret Wheatley
If you like what you read here, pass it forward to a few friends and ask them to do the same. Like a pebble tossed in a pond, the rings emanate outward, reflecting and growing exponentially. “Going exponential” is what it will take to reverse the climate extremes that are accelerating around us.
Thank you…
+ Get an alert when there’s a new Earthrise post: Notify Me!
+ Previous Earthrise posts:
• First Light • Robert Dash – photographer, educator, environmentalist • Extreme Rain • A Poem for the Snow Leopard •
• How the Chinese spy balloon can inspire climate action • Tidal energy in the Salish Sea •
Notes
The Climate and Sustainability Advisory Committee was established in 2022 by the San Juan County Council to ensure coordination and communication of actions across departments and to feed into existing county advisory committees and commissions. The committee advises on policy, helps set priorities, and harnesses the momentum of existing work to help steer the County’s climate action plan. The goal is to provide opportunities for the cross-pollination of ideas and to increase collaboration around climate and sustainability efforts throughout San Juan County.
– Kendra Smith, Director of the Department of Environmental Stewardship is the committee chair
– Angela Broderick is Climate and Sustainability Coordinator
– Council Member Cindy Wolf is Council Liaison
– Council Member Jane Fuller has the lead on the issue of transportation for our county
Diesel Emissions and Health Impacts
What you can do to reduce GHGs
The northwest is transitioning to a warmer El Niño cycle. It will likely be dryer, with increased drought and fire risk. Wildfires are radical GHG emitters, not to mention all the toxic synthetic chemicals emitted when buildings burn.
**If you are reading theOrcasonian for free, thank your fellow islanders. If you would like to support theOrcasonian CLICK HERE to set your modestly-priced, voluntary subscription. Otherwise, no worries; we’re happy to share with you.**







It has been said that there are three kinds of lies: white lies, damn lies and statistics. Bar graphs with “estimated” values ought to be in there somewhere too I think!
Jay – I cannot seriously believe that you think that the carbon impact of SJC residents is confined to the islands; that is patently absurd, especially regarding the carbon footprint of agriculture; almost none of the food eaten in SJC is grown here so not measuring it honestly is, at best, misleading. Similarly with electricity; it’s not being generated here, so it doesn’t count? And what about the driving or flying that visitors do enroute to the islands? The only accurate measurement on the page is the WSF diesel consumption and those ferries run (when they aren’t canceled!) whether there is anyone on them or not.
Castigating visitors for OUR carbon footprint is simply disingenuous. How much driving do islanders do on the mainland? I put more miles on my truck in one day off island than in a month on Orcas. Reminding people of their environmental impact is, of course, important, but do it honestly.
Thanks, Jay. Always fascinating and educational.
Thank you Jay for collecting and sharing such vital information. Public transportation is long overdue in the county, but we can now take the leap directly to electric busses and electric bike rental allowing for more ferry foot traffic and less island car traffic.
Thanks for this blogpost! Interesting to see how much of a role transportation plays. Bring on the walking and bicycles and e-bikes and public transportation and EVs! Here at the Lopez Community Land Trust we’ve got an interesting EV carshare program started, sharing an EV among all the households living in Land Trust homes.
It would be helpful to disaggregate the number of one-day visitors that are commercial vehicles from those that are tourists, so that the latter category does not take the blame for all the GHG emissions made by the former.
Thanks Deb, Eric. Chris, Michael and Ken.
Michael, the Visitor Bureau data doesn’t give us visibility into visitor vehicle type. We used a 25 MPG gasoline efficiency while recognizing that some of those vehicles might be much lower MPG tractor trailers, but perhaps balanced by other zero-emission EVs.
Ken, this post is focused on local GHG emissions. Estimates will be refined with the May release of Cascadia’s county GHG Inventory.
The GHG inventory stats are essential for understanding where to focus decarbonization solutions and winning state and federal grants to fund those solutions. To learn more about GHG inventory stats and what the state is doing to achieve net-zero emissions, see:
https://ecology.wa.gov/Air-Climate/Reducing-Greenhouse-Gas-Emissions/Tracking-greenhouse-gases/GHG-inventories
Here are a few more stats to chew on. At the state level, transportation GHGs are also the biggest single source of emissions – about 46% of state emissions. Diesel ferries represent about 65% of state vehicle fleet emissions.
An inspirational article. I think there are ways to start addressing this problem. First, we need to push for the implementation of electric powered ferries, like what BC ferry system is doing. Second, I would suggest once Washington State Ferries are converted to electric power, or maybe even before, restrict the number of fossil fueled vehicles to board the ferries. Third, as an incentive for using electric vehicles, OPALCO could selectively install free charging stations around the island (restricting times, number of times, and type of vehicles that can use them). These are just a few solutions that come to my mind that could be implemented to start the reduction of greenhouse gases on and around the San Juan Islands. In fact, I just read that Hawaii is now going to issue licenses for people to visit various sites on its islands as many of the sensitive habitats are being impacted by tourist, perhaps something that could be considered for our islands. We need to think how we can transition from fossil fueled vehicles to electric vehicles in a fair and equitable manner. Food for thought.
Gary Greene
Every gallon of gasoline burned in an internal combustion engine produces about 20lbs of carbon dioxide. (Diesel is a bit more, about 22lbs of carbon dioxide per gallon.) Carbon dioxide persists in the Earth’s atmosphere for generations. Think 60 plus years. Yes, island-surface-vehicles are a huge problem.
Do you know how many gallons of fuel the Anacortes-San Juan Islands ferries use on an average day?
The answer is electric vehicles and enhanced solar production and storage–on all the islands.
Tick, tick, tick… The glaciers, our hydro (battery) source, are destabilizing due to GHGs.
Looking at our local contribution to worldwide GHG is helpful; thank you Jay. One escape from reality is the argument that ultimate accuracy in this kind of measurement is not reasonably obtainable. Its twin escape is blame: “Well what about (naming a disfavored group)?” These are instinctive responses to avoid personal responsibility. I can feel it in myself. And the result is business as usual, or in some cases regulation or sin taxes to coerce a general response in which people are more (but not perfectly) willing to contribute to the general good so long as everyone else carries the same burden.
Imagine an ocean liner with its hold full of creatures whose lifestyle includes drilling holes in the hull. Why should anyone stop? Everyone else is doing it, and if one creature stops drilling, it knows that someone else will drill a larger hole; furthermore, some groups of creatures called corporations drill much larger holes, so what’ the point? Drill baby drill!
There is a wisp, an aroma, a hint, of another point of view. It is contained among many other expressions and actions, in the phrase “If I knew the world would end tomorrow, I would plant a tree today.” It starts with us. Examples are more powerful than lectures (but graphs help!). And visitors, being people, can learn.
There is no such thing as LOCAL when it comes to GHGs. The location of the tailpipe doesn’t really tell you who is actually causing the pollution, meaning who is benefiting from it. Meaningful action only actually happens at the level of personal decision making. Focusing on personal carbon footprints is going to motivate people to change their behavior far more convincingly than county-wide data sets of dubious accuracy. Show people how much carbon dioxide is generated per seat by flying across the continent or the amount of carbon released by shipping a bell pepper from Mexico to Island Market if you want to change their behavior. Show an honest accounting of the environmental footprint of building a new electric vehicle and the true footprint of electrical generation, including the death of river ecosystems by hydroelectric dams. The answer to transportation pollution is not more cars, electric or not. The answer is fewer cars, more walking and public transport that actually works. L.E.S.S. (Less Energy, Stimulation and Stuff) is the answer.
Agreed that it is a matter of personal decision making. The data is simply the cumulative effect of a multitude of personal decisions. We know that we are contributing to the deterioration of nature in all of its forms. For most problem solving, this would be sufficient to initiate change in behavior, but in this case, it will take more: a change in comprehension and acceptance of personal responsibility.
Interesting to see the ferry emissions visualized against other sources. I knew it would be high, but wow. WSF (as a whole) burns 19 million gallons of diesel fuel per year: https://wsdot.wa.gov/construction-planning/major-projects/ferry-system-electrification
The CO2 emissions are huge, and it shows that living out here is not as “clean and green” as it seems, even though the majority of Washington’s electricity comes from renewables. Electrifying our ferry system can’t happen soon enough.
Thank you, Jay, for graphically pinpointing our “local” contribution to GHG emissions, and, in particular, that the ferries represent 65% of state vehicle fleet emissions. As you say, “GHG inventory stats are essential for understanding where to focus decarbonization solutions. The Islands have long lobbied Olympia for priority for the first hybrid diesel-electric ferries, but have been de-prioritized in favor of south-sound routes. It would be interesting to know what percentage of ferry “vehicle miles traveled” is accounted for by each ferry route.
Beyond the ferries, themselves, it would be significant (though probably not possible) to estimate the aggregate VMT by the vehicles carried on each run. (How far are those cars from Washington, Oregon and California traveling to get to Anacortes?) The answer, as Ken suggests, is, ultimately, fewer cars–which means better public transportation connections at each end. How does that work at OUR end? What does public or “shared” transportation look like for a rural community with widely dispersed destinations? I think that that, along with local prioritization and pricing disincentives for visitor vehicles, that is OUR problem to solve.
To focus on EVs and electrifying transport as a solution to GHG emissions in this county, as many commenters suggest, is basically saying “I don’t have to deal with the impacts and emissions of mining, refining, manufacturing, and waste from cars here in SJC, and don’t care about the pollution that is displaced from the tailpipes here to the lives of humans and non-humans elsewhere.” Not only does that attitude ignore emissions in the supply chain as Ken Wood says, it ignores the incredible destructiveness of mining and manufacturing cars and batteries that takes place mostly in poor countries. The impacts of mining cobalt for batteries on the children in the DRC cobalt mines, the impacts on communities in Indonesia in the nickel mines, the impacts on indigenous communities in South America at the lithium mines–all safely ignored when the focus is on local emissions instead of the big picture. The big picture is that cars and car culture and indeed industrial culture is not sane, not sustainable, and not compatible with a living planet.
To those who say “electric vehicles are the solution to GHGs from transportation”… As just one of so many examples (this one published April 4, 2023), this is what the rush for materials for EVs and their batteries (and grid storage batteries) is doing:
—-
Indonesia: Uncontacted tribe being destroyed for electric car batteries
A unique uncontacted tribe could be wiped out by a massive Indonesian project to produce nickel for electric car batteries.
A vast mining scheme on the island of Halmahera is part of Indonesia’s plan to become a major producer of electric car batteries – a plan into which Tesla and other companies are pouring billions of dollars.
But nickel mining is set to destroy vast areas of the forested interior of Halmahera. These forests are inhabited by 300-500 uncontacted members of the Hongana Manyawa tribe. If mining goes ahead as planned, they will not survive the destruction.
The Hongana Manyawa – which means ‘People of the Forest’ in their own language – are one of the last nomadic hunter-gatherer tribes in Indonesia.
They now face the threat of seeing their land, and everything they need to survive, destroyed by corporations rushing to provide a supposedly ‘sustainable’ lifestyle to people thousands of miles away.
(From https://www.survivalinternational.org/news/13670)
—
Are we really okay with pillaging the planet more for more non-renewable materials, destroying people who truly are living sustainably and their natural environment, just so we can drive cars just a little bit longer? Because I’m not.
These are the stories I think about whenever I get yet another email from OPALCO pushing EVs to our community. Just like fossil fuels and their GHGs are never “local”, neither are batteries, cars, or anything else made with what Lewis Mumford calls “authoritarian technics”–that is, technologies none of us could ever make on our own with materials from the local environment.
Plan for a sustainable future: If you can’t make it at home, it shouldn’t be made. If it destroys the land base, it shouldn’t be done. Or to quote Aldo Leopold, “A thing is right when it tends to preserve the integrity,
stability, and beauty of the biotic community. It is wrong when it tends otherwise.”
The elephant in the room . . .