
— from KOMO News —
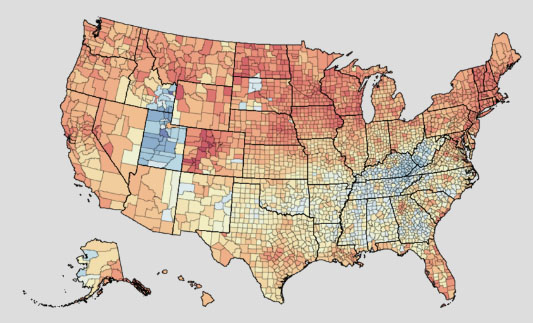 This interactive map shows the obesity and alcohol drinking rates of every county in America, with men topping both categories in overwhelming amounts.
If you hover over each county, you’ll see the drinking and obesity rate in that specific area and how it compares to the rest of the state and country – the red areas are doing the worst, blue the best, the orange hues leaning more towards the bad, and yellow in the middle.
Nearly 40 percent of Americans are obese having gone up almost six percent since 2011, the latest figures on the map. And although the obesity rate isn’t entirely surprising, the fact that there are fewer obese woman than men is.
San Juan County has the lowest obesity rate in Washington state – 25 percent of obese men and 26 percent of obese woman. King County comes in a close second, with 28 percent of obese men and 29 percent of obese woman. Adams County is among the worst in the state, with 45 percent of men who are obese.
Top five counties in Washington with the most male drinkers:
- San Juan County – 75.8 percent of men
- Island County – 71.6 percent of men
- Jefferson County – 72 percent of men
- Whatcom County – 70.17 percent of men
- Lincoln County – 70.26 percent of men
Top five counties in Washington with the most female drinkers:
- San Juan County – 70.44 percent of women
- Jefferson County – 64.88 percent of women
- King County – 63.03 percent of women
- Kittitas County – 62.2 percent of women
- Island County – 62.18 percent of women
Researchers at the Institute for Health Metrics and Evaluation, a Seattle company part of the University of Washington and funded by the Bill & Melinda Gates Foundation, created this interactive map to measure the world’s most prevalent health problems and help policymakers address them.
You also can see the rate of change over the course of 11-plus years, and compare the life expectancy, risk factors, and mortality rates and risks to other counties in America.
READ FULL ARTICLE: https://komonews.com/news/local/interactive-map-shows-obesity-alcohol-rates-in-every-county-in-america

**If you are reading theOrcasonian for free, thank your fellow islanders. If you would like to support theOrcasonian CLICK HERE to set your modestly-priced, voluntary subscription. Otherwise, no worries; we’re happy to share with you.**


So what’s the takeaway here?
Drink more, stay skinny.
Maybe a new tourism slogan for SJC?