— from The New York Times —
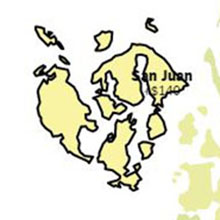
If a child in a poor family were to grow up in San Juan County, WA, instead of an average place, he or she would make $140, or 1 percent more, at age 26.
San Juan County is pretty bad for income mobility for children in poor families. It is better than about 40 percent of counties.
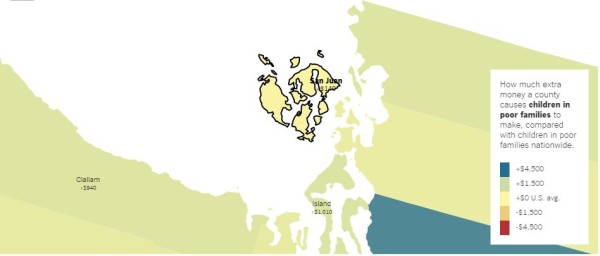
Location matters – enormously. If you’re poor and live in Washington, it’s better to be in Whitman County than in Grays Harbor County orCowlitz County. Not only that, the younger you are when you move to Whitman, the better you will do on average. Children who move at earlier ages are less likely to become single parents, more likely to go to college and more likely to earn more.
Every year a poor child spends in Whitman County adds about $210 to his or her annual household income at age 26, compared with a childhood spent in the average American county. Over the course of a full childhood, which is up to age 20 for the purposes of this analysis, the difference adds up to about $4,100, or 16 percent, more in average income as a young adult.
These findings, particularly those that show how much each additional year matters, are from a new study by Raj Chetty and Nathaniel Hendren that has huge consequences on how we think about poverty and mobility in the United States. The pair, economists at Harvard, have long been known for their work on income mobility, but the latest findings go further. Now, the researchers are no longer confined to talking about which counties merely correlate well with income mobility; new data suggests some places actually cause it.
Consider San Juan County, Wash., the focus of this article. It’s below average in helping poor children up the income ladder. It ranks 980th out of 2,478 counties, better than about 40 percent of counties. It is relatively worse for poor girls than it is for poor boys.
Here are the estimates for how much 20 years of childhood in San Juan County adds or takes away from a child’s income (compared with an average county), along with the national percentile ranking for each.
What a Childhood in San Juan County Does to Future Income
For poor kids
| GROUP | INCOME CHG. | NAT. PCT. |
|---|---|---|
| All kids | +$140 | 40% |
| Boys | +$1,310 | 55% |
| Girls | -$1,330 | 23% |
For average-income kids
| GROUP | INCOME CHG. | NAT. PCT. |
|---|---|---|
| All kids | -$1,610 | 10% |
| Boys | -$340 | 27% |
| Girls | -$3,170 | 3% |
For rich kids
| GROUP | INCOME CHG. | NAT. PCT. |
|---|---|---|
| All kids | -$3,250 | 1% |
| Boys | -$2,030 | 6% |
| Girls | -$4,840 | <1% |
For kids in the top 1%
| GROUP | INCOME CHG. | NAT. PCT. |
|---|---|---|
| All kids | -$4,320 | <1% |
| Boys | -$3,300 | 4% |
| Girls | -$5,920 | <1% |
Across the country, the researchers found five factors associated with strong upward mobility: less segregation by income and race, lower levels of income inequality, better schools, lower rates of violent crime, and a larger share of two-parent households. In general, the effects of place are sharper for boys than for girls, and for lower-income children than for rich.
“The broader lesson of our analysis,” Mr. Chetty and Mr. Hendren write, “is that social mobility should be tackled at a local level.” Here’s where San Juan County stands among other places in the state.
How San Juan County ranks among places in Washington
| COUNTY | POOR BOYS | POOR GIRLS | AVERAGE BOYS | AVERAGE GIRLS | RICH BOYS | RICH GIRLS | RICHEST BOYS | RICHEST GIRLS | MEDIAN RENT |
|---|---|---|---|---|---|---|---|---|---|
| Whitman | 1st | 3rd | 5th | 2nd | 18th | 6th | 24th | 13th | $579 |
| Spokane | 2nd | 27th | 4th | 23rd | 14th | 18th | 18th | 11th | $617 |
| Snohomish | 3rd | 1st | 6th | 4th | 11th | 10th | 15th | 23rd | $921 |
| Lincoln | 4th | 6th | 3rd | 3rd | 3rd | 2nd | 5th | 1st | $452 |
| Adams | 5th | 2nd | 2nd | 1st | 2nd | 1st | 3rd | 3rd | $467 |
| San Juan | 18th | 34th | 28th | 34th | 30th | 34th | 30th | 33rd | $706 |
| Asotin | 30th | 19th | 20th | 11th | 13th | 4th | 8th | 4th | $565 |
| Skagit | 31st | 16th | 31st | 12th | 28th | 12th | 28th | 12th | $777 |
| Cowlitz | 32nd | 31st | 26th | 32nd | 19th | 28th | 14th | 26th | $612 |
| Grays Harbor | 33rd | 28th | 24th | 26th | 17th | 19th | 13th | 14th | $557 |
| Pacific | 34th | 11th | 17th | 9th | 4th | 8th | 1st | 9th | $533 |

**If you are reading theOrcasonian for free, thank your fellow islanders. If you would like to support theOrcasonian CLICK HERE to set your modestly-priced, voluntary subscription. Otherwise, no worries; we’re happy to share with you.**