||| by Minor Lile, Orcasonian reporter |||
With smoke from western wildfires adversely affecting local air quality, there are various online resources where one can obtain current information.
A good place to begin is with the San Juan County home page, where you can check for the most recent updates on the situation. (www.sanjuanco.com).
The Washington State Department of Ecology website has numerous resources, including a smoke forecast map that provides map-based information on smoke conditions expected for the next 48 hours. The WA State Department of Health website includes useful information on the overlap between COVID-19 and wildfire smoke.
PurpleAir.com provides the most local current air quality readings, with readings from two monitors on Orcas Island, one on Lopez and two on San Juan Island. The Orcas monitors are located at the Rosario Seaplane base and on Buck Mountain. A third monitor, located at the Orcas Senior Center, is out of service at this time.
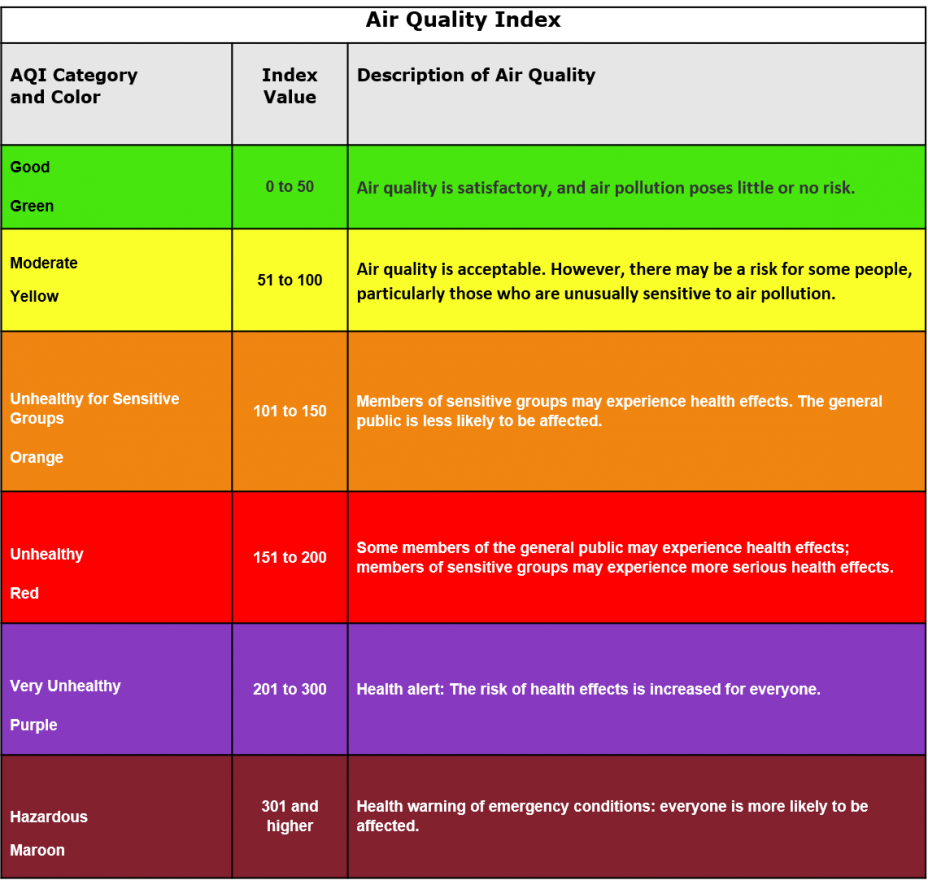
The numeric values provided by the PurpleAir website are based on the EPA Air Quality Index. The higher the number, the greater the risk to health from prolonged exposure. Particulate matter, such as that found in wood smoke, is one of five air pollution sources that is included in calculating the air quality index level.

**If you are reading theOrcasonian for free, thank your fellow islanders. If you would like to support theOrcasonian CLICK HERE to set your modestly-priced, voluntary subscription. Otherwise, no worries; we’re happy to share with you.**


Unfortunately, the Purple Air monitors are low-cost devices that do not measure smoke particulates accurately. To get a better idea of the actual values, you have to use one of the two correction factors available. I use the LRAPA correction, which lowers the readings substantially, but it was developed for the Lane Regional Air quality management agency in Central Oregon and may not apply here. The other correction factor was developed for Utah, which may be even less accurate.
The real problem is that the County Council refuses to join the Northwest Clean Air Agency—unlike Island, Skagit and Whatcom Counties—which would cost us only about $6000 annually, and thus we do not have a high-quality air-monitoring system in the islands, which could then be used to calibrate the Purple Air monitors and provide a reliable correction factor. Along with a national expert on air pollution from UCLA (who now lives on Orcas Island), I have been trying to make this point for years with Rick Hughes, but our recommendations seem to have fallen on deaf ears.
Thanks for the added information Michael. I’d read that PurpleAir was a global consortium of citizen scientists/volunteers that aims to continuously improve their accuracy. It does have the advantage of being the only site I know of that has readings from locations on Orcas. What would you recommend as a better resource?
Another good site that’s come to my attention is the Washington Smoke Information blog: https://wasmoke.blogspot.com/. It’s a lively site, with daily updates.
No matter what correction factors are needed, I’d think we can get a pretty good relative sense from the {urple Air monitors of where in the county we are impacted the most. And right now, that would be Eastsound. Interesting that the only readings higher seem to be east of the Cascades. When the wind and fire prevalence change, so will these readings, I suspect….
I’d recommend the Purple Air monitors using the LRAPA correction, but then the readings seem to come in a bit low compared to the high-quality NWCAA monitors in Bellingham, Anacortes and Mount Vernon. Best I can say right now is that AQI is about 200 in the islands and will remain so until we get some good winds to blowthe smoke away, hopefully on Sunday.
Margot, I don’t think the purple air monitor on Buck Mountain can be extrapolated to all of Eastsound, since it’s presumably at a higher elevation. Michael, please correct me if it’s not.
Ignore the Purple Air readings from the two stations on Orcas. If you look closely at the type (both PA-I) – they are indoor air sensors and not outdoor ones. Which is why the Rosario-area one always shows a much lower reading and for some weird reason the Buck Mtn one shows a crazy high reading that is inconsistent with other outdoor sensors (PA-II) on Lopez, Lummi, San Juan etc. You can uncheck “inside sensors” in the data layer key to not show them on your map.
DBIUA is going to order some sensors and set them up at a few locations in our network, but as you might imagine they are on 8 weeks back-order. So at least we will have better coverage for next year.
My sensor on Buck Mountain shows as “indoor sensor” on the Purple Air map but the sensor was actually outside the last couple of days. I took it back in today after the rain started (you can see the drop from around 360 to 240). The “crazy high” readings during the last couple of days were taken outside and may be due to the elevation we’re at: 1,440 ft. As has been pointed out, the Purple Air sensors are not very accurate. They are pretty good in relative terms i.e. in showing increases and decreases in the air quality index but not very accurate in absolute terms. If you google it, you can find test results where Purple Air (and other) sensors were tested in a controlled environment against reference air quality measurement stations. For 2.5PM (particulate matter < 2.5 micrometers) the Purple Air sensors show 30-40% higher concentrations than the reference stations but have very good correlation in terms of relative air quality changes.