— from Tom Owens —
My Social Security (and other income based of SS) seems to be shrinking fast. Orcas seems to be, step by step, becoming LESS affordable!
Are we asking for too many services and benefits? Could we all think about affordability just a bit more when we vote for new levies? Could those folks on the local boards and commissions consider affordability when they raise their budget amounts (which become increases in our taxes)? Could our assessments be a lot fairer and more consistent than in the past? Could our State legislators consider affordability as they raise their budgets? A little careful restraint and efficiency increases could help a lot.
Affordability can be examined by looking at the difference between rising costs and changes in incomes. If costs are rising faster than income, things are getting LESS affordable, and they ARE.
Incomes could be measured for folks on fixed incomes by looking at the rise in their social security checks (ignoring the increased deductions for Medicare). They were:
2015: +1.7%
2016: +0.0%
2017: +0.3%
2018: +2.0%
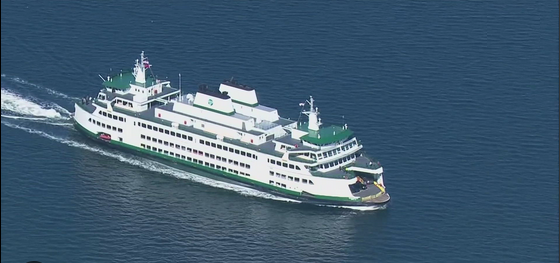
For Cost Changes, let’s look at four measurable areas; WA State Ferry, OPALCO, State Property Tax and Local Property Tax.
WA State Ferry costs changes are based on the 5 trip pass. We all use the ferries. Fares continue to rise:
2015: ?
2016: ?
2017: +2.77%
2018: +2.5%
OPALCO has been raising its residential rates rapidly and we all pay for electricity. For the “average” customer using 1000 kwh/mo. (excluding the $1,000,000 we paid for Rockisland in 2015-2016, as these were for purposes other than the electric business) the changes were:
2015: ?
2016: +4.4%
2017: +7.6%
2018: +5.3%
Total Property Tax is the sum of the State’s tax and all the junior taxing districts taxes that apply to Orcas. Property owners pay these taxes directly. Renters pay them through increased rents. Even food, services and fuel prices have a property tax component. Based on Tax Amount for each year published by the County in its Tax Levy Changes tables, here is how they have changed:
2015: +1.8%
2016: +1.16%
2017: +3.56%
2018: +21.2%
State Property Tax jumps around due to inaccuracies in our assessment values and increases in the State Budget. In 2009, right after the “crash” Orcas assessments our tax code area went up an astounding 28.8%. They continued to rise, despite the poor real estate market, through 2012. In 2013, they fell an amazing 43.8%. Again in 2018, they jumped 8.5%. State property taxes took a jumped 2018 to pay for the McCleary school funding requirement and were:
2015: -3.71%
2016: +0.53%
2017: -2.85%
2018: +48.99%
The local property taxes, over which we have some control, also contribute to our costs here. Understand that we vote for these taxes.
Orcas Schools have undertaken two renovation projects (2015 and 2018) and added the athletic track (2018).
2015: +14.36%
2016: +1.00%
2017: +1.80%
2018: +23.96%
San Juan County stayed in a range close to 2%/yr. However, the Roads budget jumped 6.21% in 2017 (not included below).
2015: +2.05%
2016: +1.83%
2017: +1.78%
2018: +2.09%
Port of Orcas had one major budget increase in 2015.
2015: +4.16%
2016: +2.07%
2017: +1.72%
2018: +2.22%
Orcas Fire generally stayed below 2% each year.
2015: -1.46%
2016: +1.5%
2017: +2.14
2018: +1.93%
Orcas Library saw the facility expansion in 2017 but stayed around 2%/year otherwise.
2015: +2.03%
2016: +1.94%
2017: +47.97%
2018: +2.07
Orcas Parks had one major budget increase in 2017 but stayed in the 2% range otherwise.
2015: -1.29%
2016: +2.33%
2017: +66.53%
2018: +2.07%
Comparing my Social Security Check with these four rising cost areas (especially the major budget increases); I seem to be losing ground fast. Yes, they are all good and, for some folks, necessary things to have available for us on Orcas. I just would ask that we consider affordability a little more as we vote for new services and benefits. Our State legislators, local boards of directors, and commissioners should keep affordability in mind as they steadily increase their budgets.

**If you are reading theOrcasonian for free, thank your fellow islanders. If you would like to support theOrcasonian CLICK HERE to set your modestly-priced, voluntary subscription. Otherwise, no worries; we’re happy to share with you.**


Move to the Big Island Tom. Cost of living is less than Orcas.
Scott,
Thanks for your advice. It sure is less costly on the mainland.
Do you really think I (and folks on fixed income) should have to do that?
If we do move, is that the kind of place you want to live in?
Thanks for your letter Tom. It is getting increasingly difficult for people of modest means to stay on Orcas. While individual tax increases, levies, and fees don’t seem very expensive, when added up together they are significant. Especially for those who are on fixed incomes.
The solution, other than moving away, is to stop voting yes on every new tax, levy, or project that our fellow citizens propose.
Thank you for your well researched article! Moving shouldn’t have to be an option. The attitude expressed in one of the Comments about moving has been engendered by those who are making Big Bucks by destroying what was once an Island Community. It will do well for all of us to remember that Every Party ends sooner or later. I personally hope it is sooner.They vowed to make it a West Coast Nantucket and it’s almost true now.
Tom makes a great point. I feel very strongly about this. The full time residents of Orcas (and other islands) are the backbone of our community. For us part-timers, there would be no “wonderful Orcas escape” if we didn’t have all the conveniences provided by the full timers. Some day I hope to be able to give back to our wonderful community in a substantial way (unfortunately, I am not there yet). I dream of creating opportunities in a way that would ease the burden for the many wonderful folks who have willingly passed up a higher standard of living on the mainland to create the remarkable community, we part-timers, know as our Orcas escape.
I would love to hear ideas on how to help our community. Personally, I would love to purchase some homes and rent them to locals at 1950s’ prices. Other ideas are welcome.
Thank you, Tom….we’ll figure something out.
Tom,
I’m moved by your comments; they are quite valid; to dismiss them or, worse, to ignore them shows true indifference.
Personally, I’ve got no quick answers but a suggetion that we seriously give your words much more thought.
Americans are a private discrete people. The truth that you won’t hear is that many people on Orcas receive through a combination of various passive (or less passive) streams of income enough money to afford any and all such increases for the remainder of their lives and beyond.
Some of these same people are not yet retired and have active income on top of these passive streams.
Therefore, for many it’s easy to place you into a “no can fix” box and set you aside as a special unresolveable case. That box, however, grows bigger by the day.
Yet, your complaint (because that is what it is as you are not advocating a “no”’vote on the PHD -at least not directly) is so very reasonable.
The trends you speak of are worse than you know. Where I live part of the year, the cost of living is much higher than on Orcas and people of your means don’t even exist to furnish your input and perspective. Is this right? Surely not.
I consider myself a mixed-economy capitalist with a special empahsis on humanity. There’s a “social contract” undergirding our society that never gets discussed openly; in much of the world that contract is broken beyond repair or never truly existed; it’s an obligation of local state and federal governments. They vie with private industry to tweek, regulate and govern to maintain as large of a middle class as is possible. Sometimes with less oversight (like now with de-regulatory Trump); sometimes with more oversight and control as in the last administration.
Regardless of who’s in the white house, though, the “cost of living” increases annually even when technology supposedly reduces costs by displacing ten of thousands of jobs— which will soon to be in the tens of millions— through automation.
[as a side, some silicon valley titans have suggested establishing a guaranteed automatic salary unrelated to work…people like Biden say no way…one can imagine a human society without any incentive, living off the dole en-mass, no means to escape your fixed, caste-like standard of living. Yes, these are the suggestions of our current techno-overlords to the serfdom…all this instead of making conscious decisions in view of humanity, not in spite of it]
There is nothing inevitable about these trends. These are conscious decisions being made by society’s caretakers/trustees with our explicit or ignorant complicity.
What I’m getting at is that we should be thinking about the larger forces that lay behind your valid complaint,Tom, which are the more true driving factors here.
Do we need to create mass instability by displacing human labor just because we can? with robotics and AI? in order to maximize profit?
If so, at what cost to the the fabric of society?
Would the reply be it’s necessary to continue maximizing productivity in order to remain competitive globally and protect Americans’ purchasing power? There is a credible argument here. But then this begs even deeper questions.
If the US were to consciously choose a slower lane, to retain human labor, to focus less on productivity and more on building a healthy, organic human community where the basics in life were a given, would it require cooperation globally?…as in a global choice not to let the consequences of an unfettered discovery of knowledge automatically and somewhat unconsciously dictate our decisions and directions, socially…because that’s what we have now and most implicitly agree that “there’s no stopping knowledge.”
But can we regulate and consciously decide how it’s used?
All that is newly discovered isn’t necessarily beneficial for humanity or strengthens the cohesion necessary to live in peace….especially if used without a framework, without pre-discussed and understood social priorities.
Where’s that discussion taking place? Where’s our deliberate and intentional participation in society at this level?
What’s often lost in the equation of “progress for its own sake” is the “human” element.
These are decisions being made with or without your knowledge.
We need to speak up, ask more questions, and organize to actively manage the framework that will hold, shape and decide how amazing advancements in science and technology can be used to actually improve our human lot.
Let’s indeed think over these matters that begin with your very personal financial predicament, Tom. Because many more are waiting in line to join your
already swollen ranks.
It’s a trend we can interrupt and re-direct if we so choose.
Great Stuff. When we sttobrf on Orcas in 1987 it was like a ruined Haida Village. Desert4d and washed out. I loved it!
Now, well, decay is us.
We suffer in what Uncle Karl called “late capitalism”s As Suxh suffering entails the sacrifice of that most central to our humanity – community. intimacy, familiarity.
Like the woman said it’s either socialism or barbarism If we don’t move towards the former the latter prevails.
Time for some Orcans to face the hard realities of class relations in America and how they have mutated our community.
Joe,
A govt system is only as good as the people under it. My problem with de-incentivizing systems of human organization (pure socialism or communism) is that human nature just wont be caged or have its wings clipped. The pigeon will never have the condor’s wingspan no more than I’ll ever have Michael Jordan’s reach…we make do with the talents we’re born with and turn each into whatever we can—no complaining!
Nature doesnt tolerate anything that contradicts reality. Don’t kid yourself; we may have larger brains but we’re nature!
That’s why communism, socialism, capitalism or any other “ism” does not and never will exist in their ideal forms…they’re merely abstract thought experiments that conflict with human nature in their ideal forms…hence, my settling for a mixed economic model that doesn’t de-incentivize human behavior but make room for the truly needy as a result of matters beyond a person’s control (i.e., a safety net).
There’s something in the middle…usually always is.
Apart from the classical arguments about which “ism” is better than the other, we’re now dealing with larger transformations and many are left confused… there’s a new language (coding …0’s and 1’s and everyone is being converted into an algorithm); as a result, many have been rendered illiterate in this new world…hence, the panic and somewhat bizarre political results of late.
This is why discussion and real leadership are needed— to step back, assess and actually steer our boat instead of remaining clueless and rudderless.
We can make technology and science work for us but those who care most about humanity’s welfare need to speak the new language so that conversations can take place and so that the most important decisions about the kind of society we want to live in aren’t being made in a Silicon Valley echo chamber.
Two intelligentsia centers now exist in the US——DC and Silicon Valley (and their shadow extensions on the W Coast). Both centers are brilliant but both are talking past each other due differing agendas and languages.
The lack of effective communication between the above two influential current power centers is beginning to result in political and economic upheaval.
Witness our last national election result and the growing tension over concern about near future large displacement of the labor force via automation; these are nation-altering transformative events.
These waters can be chartered but we need to understand the nature of these transformations, extrapolate their assumptions and speak intelligently about priorities.
Again, we need leadership— leadership that can recognize both the advantages and disadvantages of technology and science and ensure that both serve, not undermine, a stable human society.
As always, an interesting and thought-provoking discussion; one such as this pops on on this board every few months. The basic comments are always that Orcas was ideal in the past and is about to be as horrific as “Nantucket.” This fear-based thinking is way off base. Without repeating things I have said in the past, there are many reasons Orcas can’t ever become Nantucket (not that having amazing beaches open to the public and a fully staffed hospital tied to a Level 1 trauma center would be such a bad thing…)
Spirit Eagle, your comment that Orcas “was once an Island community” suggests that you think it is no longer. Is that really what you believe? If so, maybe you need a Make Orcas Great Again hat? I still thinks it’s a fabulous community and would love to be able to call it home some day. Many other agree with me and have posted saying so.
The economic problems on Orcas are pretty similar to many other places around the country where many who work and provide services can’t afford to live in the community. No easy solution for that, but it’s not unique to Orcas. What is different is that people on Orcas seem to really want to address the issue and to help those less financially able. Just as people are putting up almost 1M for a PHD perhaps they would be just as interested in putting up an equal amount for subsidized housing? But the more subsidies are made, the more tempted/incentivized people will be to move to Orcas. A true dilemma.
As for full time vs. part time residents, this can be viewed many ways…Part timers actually subsidize the town considerably by paying taxes for services they don’t really use. The part timers tend to be older, don’t have kids in the school and need less police/fire intervention. And many are philanthropic as well (how many part timers contributed to PHD/Orcas Medical bailout?) Face it, Orcas needs part timers just as does Nantucket, Sanibel, and many other small communities.
Tom (and other readers)- there is a real error in comparing percentages in data. It’s not scientific and can lead to erroneous conclusions or skew things. In other words, you can’t add percentages. In that sense, the “data” analysis isn’t real.
I do agree that the COL is going up. That’s hardly a headline.It’s true everywhere and is driven largely by things such as healthcare costs, energy costs, infrastructure costs and salaries for employees. But, the reality is that the wealthy have decided to obliterate the middle class in our country and most of us won’t get the wage increases that would be commensurate with the economic growth being created. That’s the stuff of real revolutions.
Joe, if Orcas is your definition of “decay” may I invite you to visit any Caribbean Island nation, US inner city, or all of Central America?
For those on Orcas who thinks it’s too busy/crowded/developed there are numerous lots/homes for sale on outer islands (Waldron, Stuart, Johns, Sinclair, etc.) so isolation is easily achieved in the same region.
I’m still in love with Orcas and think it’s most valuable and amazing feature is its people and community. And I hope will always be an open and welcoming place to those who feel it call.
Neil,
Thanks for that needed balance.
I agree that Orcas is still all that and more.
Aside from larger macro changes affecting the fabric of society as we write, and my suggestion that we update our personal human software to better understand, steer and have a voice in the conversations—for the moment at least—life on Orcas is still relatively ideal.
I’d be very surprised, indeed, if a majority of those owning and/or living on Orcas would prefer other so-called island paradise destinations if they experienced them up close and personal.
There’s nothing admirable, redeeming, or desirable about abject infrastructural poverty and the crime/insecurity that’s so ingrained in the habitants of central and south america, to include the caribbean.
I’m in those regions a few times a year and have now adopted the ingrained intelligence of having “common sense” serve as my “best defense,” not a 911 call. Its automatic now. But for years, upon arrival, to those keen to the details of their immediate environs, the lack of personal security was always palpable. Now I’ve adapted such that I’m relatively comfortable in far lesser secure environments that that which is found on Orcas.
Let’s hope we appreciate what we have on Orcas and prevent making the decisions that might denigrate life to the levels described above.
If any group of citizens can figure this out I’ll place my bets on the thoughtful, intelligent people of Orcas.
Tom Owens, this is a very well written and current article. I totally agree with your concerns which bear repeating: That the local boards and commissions consider affordability when they raise their budget amounts (which become increases in our taxes) and local boards of directors, and commissioners should keep affordability in mind as they steadily increase their budgets.
When will the desire for more taxing districts slow down?
Agreed, John (not to forget Tom’s original straight-forward plea).
The island can’t be all things to all people. To-date, nothing is free and it will likely remain that way forever…as it’s a principle that precedes our existence as a species, and is why we even exist in the first instance— Keep the big pic in mind when talking about the “trees,” lest you go astray and burn the forest down.
It’s more about the physical and financial restraints of a small island and a valid desire to maintain a certain quality of life here which is, after all, its main draw…this really isn’t about elitism.
Having the proposed medical services “can” enrich, not deteriorate, the quality of life on Orcas—so long as the PHD commissioners keep costs vs value uppermost in their minds (along with quality healthcare).
What we want to avoid is returning to the same trough for requests of more and more money from the likes of Mr Owens.
Hoping for the best.
We also don’t want to attract a swelling in need or population, indirectly, by being too far ahead of the curve not because it’s not morally defensible (dont even need to get to this debatable issue), but because Orcas Island is a small islolated island; it’s not a collection of sprawling subdivisions on the mainland where physical room and a mucher larger “employed” tax base can better accommodate experimental, social-subsidy programs.
The commissioners I’ve read about seem up to the task.
Balance is the key.