
From David Moseley, Assistant Secretary for Washington State Department of Transportation/Ferries
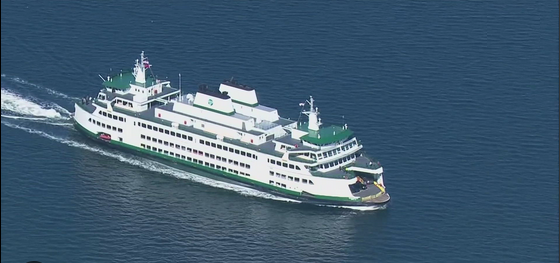
We are now well into the spring sailing schedule and that means better weather (hopefully) and more people traveling aboard Washington State Ferries.
I want to encourage you to use the best times to travel (BTTT) graphs, which show typical vehicle congestion levels, to assist in planning your next ferry trip. The BTTT graphs are available on all sailing schedule pages in the upper right corner of the Web page.
This season, we’ve made some exciting changes: for Port Townsend/Coupeville, we now have two graphs for the spring schedule reflecting the 1-boat and 2-boat schedules. For the Anacortes/San Juan Islands, we have three graphs for the distinct periods in the season to reflect how vehicle traffic patterns get heavier in the later months.

**If you are reading theOrcasonian for free, thank your fellow islanders. If you would like to support theOrcasonian CLICK HERE to set your modestly-priced, voluntary subscription. Otherwise, no worries; we’re happy to share with you.**


Great information! We will use this all the time for travel planning.